Hi, I'm Min (Mia) Shi.
A
Welcome to my GitHub Page! I’m an enthusiastic AI Engineer and Data Scientist with a passion for turning raw data into meaningful insights and solving complex problems. I specialize in GenAI evaluation, scalable ETL pipelines, and AI-powered data applications. My work includes optimizing workflows on AWS, building governance-aware LLM systems, and empowering teams with reliable analytics, quality checks, and well-documented processes. Always eager to learn and explore, I’m dedicated to pushing the boundaries of what data can achieve.
About
I'm Mia — an AI Engineer and Data Scientist who builds the intelligent systems that sit between large language models and the people who need them.
With a PhD in quantitative social science and hands-on engineering across the full stack, I design AI that doesn't just demo well — it runs in production, at scale, every day.
What I Build:
At Reframe Data Services & The Sunwater Institute, I engineer AI agent systems that power automated content generation and conversational interfaces across web applications. This includes:
- - LLM orchestration & evaluation across multiple providers (Claude, OpenAI, Gemini), with automated hallucination detection, accuracy benchmarking, and cost governance across 17+ RAG pipelines
- - Full-stack AI applications — most recently a congressional data chatbot built from scratch (React, TypeScript, Express.js, PostgreSQL) giving analysts natural-language access to legislative records with source-cited, markdown-rendered responses
- - Scalable cloud infrastructure on AWS (ECS, EKS, Lambda, EventBridge, S3) processing 100+ GB daily, with CI/CD automation achieving 99.9% uptime while cutting inference costs by 68%
- - Conversational AI interfaces with conversation persistence, multi-step reasoning, graceful degradation, and retrieval-augmented generation over organizational knowledge bases
My Approach:
I take full ownership — architecture, backend, frontend, DevOps, testing, monitoring. Social science trained me to ask whether the system actually works for the humans using it. Engineering lets me make sure it does.
If you're building with LLMs, scaling AI agents, or trying to make intelligent systems reliable in production — let's talk.
Skills & Technologies
AI & ML:
Large Language Models (LLMs) | LLM Orchestration & Evaluation | Retrieval-Augmented Generation (RAG) | Natural Language Processing (NLP) | Conversational AI | MLOps | AI Governance & Prompt Engineering | PyTorch | TensorFlow | Deep Learning | Machine Learning
Cloud & Infrastructure:
AWS (ECS, EKS, ECR, Lambda, S3, EventBridge, Glue, EC2, OpenSearch, Parameter Store, CloudWatch) | Docker | Kubernetes | CI/CD | Jenkins | GitHub Actions | Microservices Architecture
Programming & Development:
Python | TypeScript | Node.js | React | Express.js | Ant Design | Vite | FastAPI | Streamlit | SQL | API Development | REST APIs
Data Engineering:
ETL/ELT Pipelines | PostgreSQL | MySQL | AWS RDS | OpenSearch | GraphQL | Apache Spark | Data Orchestration
Testing & DevOps:
Vitest | React Testing Library | Automated Code Review | Git Hooks | Pre-commit Validation | CI/CD Pipeline Design
Certifications:
Applied Machine Learning | AWS Cloud Practitioner | Google Analytics
Languages:
English | Chinese | Japanese
Experience
- Owned quality assurance and evaluation for production GenAI agents integrating multiple LLM providers (Claude, OpenAI, Gemini), ensuring reliability, traceability, and alignment with organizational standards.
- Designed automated evaluation frameworks for LLM outputs, including hallucination detection, rule-based validation, accuracy benchmarking, and cost monitoring across 17+ OpenSearch-backed RAG pipelines.
- Applied governance controls to AI pipelines (prompt versioning, output constraints, audit logging), supporting safe deployment of decision-facing AI systems.
- Architected and delivered a full-stack AI chatbot from scratch (React 18, TypeScript, Ant Design, Express.js, PostgreSQL) enabling natural-language queries against congressional RAG pipelines — with markdown-rendered responses, source citations, conversation persistence, dark/light theming, and CI/CD automation via GitHub Actions with 50+ automated tests.
- Built CI/CD-enabled GenAI pipelines on AWS (ECS, EKS, ECR, Lambda, S3) with automated testing and rollback, achieving 99.9% uptime while reducing inference cost by 68% and latency by 44%.
- Collaborated cross-functionally with product leaders, editors, and engineers to validate AI behavior against business and policy requirements, improving analyst productivity by 40%.
- Developed and validated large-scale NLP and speech-processing pipelines (AWS Transcribe, Textract), achieving 90%+ transcript accuracy for policy-critical datasets.
- Implemented automated data quality checks, schema validation, anomaly detection, and failure monitoring to support downstream ML evaluation and reporting accuracy, reducing pipeline errors by 75%.
- Built ETL pipelines (Python, PySpark, SQL) with reproducibility and auditability to support downstream ML and analytics use cases.
- Partnered with researchers and leadership to ensure analytical outputs met documentation, quality, and governance expectations.

- Designed, evaluated, and validated 20+ predictive, NLP, and time-series models supporting applied social-policy and global-health analytics.
- Applied text mining, semantic similarity, and statistical methods to large-scale survey and unstructured text data, contributing to peer-reviewed publications.
- Translated complex analytical results into stakeholder-ready insights and visual summaries for interdisciplinary research teams.
- Led and mentored a team of five research assistants, overseeing data collection, quality checks, modeling workflows, and delivery timelines.
- Summary: Led the creation of an AI-driven chatbot, enhancing customer engagement through advanced NLP techniques.
- Employed NLP and MySQL for analyzing and querying an extensive database containing over 10 million entries.
- Achieved 25% improvement in response efficiency and provided 99% accurate predictions using XGBoost model.
- Contributed to a 15% rise in user engagement, increasing customer satisfaction and bolstering company’s image.
- Tools & Skills: Python, SQL, NLP, ML, UI Design, Leadership, Communication

- Summary: Served as a Data Analyst Intern responsible for data management, data visualization, and business analysis.
- Improved the efficiency of data extraction by 40% through data optimization in MySQL.
- Employed Microsoft Visio to visualize intricate network structures and aided in product comprehension.
- Produced Business Intelligence (BI) reports, offering insights based on user structures and competitor analysis.
- Tools: MySQL, Microsoft Visio, Microsoft Office
Projects
A six-month solo project developing a social media platform’s backend using HBase, MySQL, and Redis with Django framework in Python.
- Tools: Python · Django · AWS · HBase · MySQL · Redis
- Maximizing query efficiency by storing objects with HBase, MySQL & Amazon S3 based on query complexity.
- Addressing N+1 slow query issues by implementing Redis caching and denormalization.
- Integrating Celery and RabbitMQ to establish asynchronous workers with varying priority levels.
- Implementing a push model for distributing news feeds to followers efficiently.
- Optimizing memory and resource allocation using recursive small batches of asynchronous tasks.

Comprehensive Financial Performance Analytics of the Top Four US Airlines
- Tools: Data Mining · Business Model Analytics
- Analyzed financial data from a 20-year dataset of over 10,000 rows, covering net income, revenue, and expenses across the US airline industry. This deep dive provided insights into long-term financial trends and shifts.
- Conducted financial performance analytics for the top 4 airlines, identifying key turning points related to major events, alliances, and partnerships over the period.
- Assessed operational trends and competitive positioning of each airline, deriving specific business model recommendations based on a two-decade comparison with competitors.
Leveraging Deep Learning CNNs for Disease Diagnosis in Apple Orchards
- Tools: Deep Learning · CNN · Transfer Learning
- Utilized transfer learning on CNNs with 5,590 images in 12 categories, enhancing disease identification accuracy.
- Conducted image transformation, including rotation, flipping, zooming, and noise injections to augment data.
- Fine-tuned ConvNext DL CNN models and achieve 86.8% accuracy, securing a Top 3 ranking in the competition.

Leveraging Web Scraping for Business Prediction via NLP & ML Approaches
- Tools: Web Scraping · Natural Language Processing · Machine Learning Models
- Created an automated web scraping tool to extract more than 7,000 WSJ news articles using specified keywords.
- Analyzed WSJ articles employing Count Vectorizer, Tfidf Vectorizer, and n-grams Count Vectorizer.
- Implemented Naïve Bayes and Random Forest models; achieved a notable ROC AUC value and an increase in S&P 500 stock index prediction accuracy by 12%.
- Demonstrated consistent accuracy across various vectorizers, suggesting the potential use of NLP in forecasting stock price changes based on WSJ news articles related to U.S. trade.

Geospatial Truck Fleet Big Data Analytics and Visualization
- Tools: Hadoop ecosystem · Tableau · R
- Used big data Hadoop ecosystem to process geospatial data ingestion, transformation, and database creation.
- Performed data exploration and visualization in Tableau by connecting to Hadoop ecosystem server.
- Modeled how factors affect the truck driver risk factor, drew a final report and proposed suggestions on how to lower the probability of large trucks accidents.
Extensive Analysis of Table Spreads Industry
- Tools: SAS · Tableau · Statistical Regression Analysis · Time Series Analysis
- Researched over 1.3 million records to identify key metrics contributing to the sales of top brands
- Evaluated strengths and weakness of Conagra Brands compared to competitors in each sub-category
- Built Machine Learning and Time Series models to predict future directions for Conagra Brands

Payroll Management System Database Design via MySQL
- Tools: MySQL
- Led a group of five in conducting business requirements analysis and designing a payroll management database with MySQL consisting of 13 tables.
- Increased efficiency in extract-transform-load and payroll database management by 100% via stored functions, procedures, and triggers.

Goldman Sachs Global Business Analytics and Prediction via Python and Alteryx
- Tools: Alteryx · Python · Business Analytics · Time Series Analysis
- Researched and generated datasets of US and worldwide inflation during pre-pandemic and post-pandemic periods via Python from raw datasets
- Conducted data cleaning and preprocessing, built time series ARIMA and ETS models to forecast trends in Consumer Price Index (CPI) and Producer Price Index (PPI) via Alteryx
- Presented key trends and findings on inflation and consumer prices and the further impact on Goldman Sachs, provided insights and recommendations on global operation strategies based on the analysis

Analysis of the Effect of COVID-19 on US Trade and US Firms
- Tools: Deep Learning · Machine Learning · Statistical Regression Analysis · Communication
- Synthesized data and created fixed-effect regression models to identify correlations and causal mechanisms
- Developed and Implemented machine learning and deep learning models to conduct counterfactual analysis
- Presented findings at the 2023 Applied Data Science international conference

Modeling U.S.-China Trade War’s effect on US Multinational Corporations
- Tools: Python · R · SQL · Stata · Time Series Analysis
- Generated and managed a new database using PostgreSQL and performed data analysis in Python
- Built time series GARCH models in Stata to examine the effects of U.S.-China trade conflicts on US firms
- Presented the findings at the 2022 International Society for Data Science and Analytics Conference
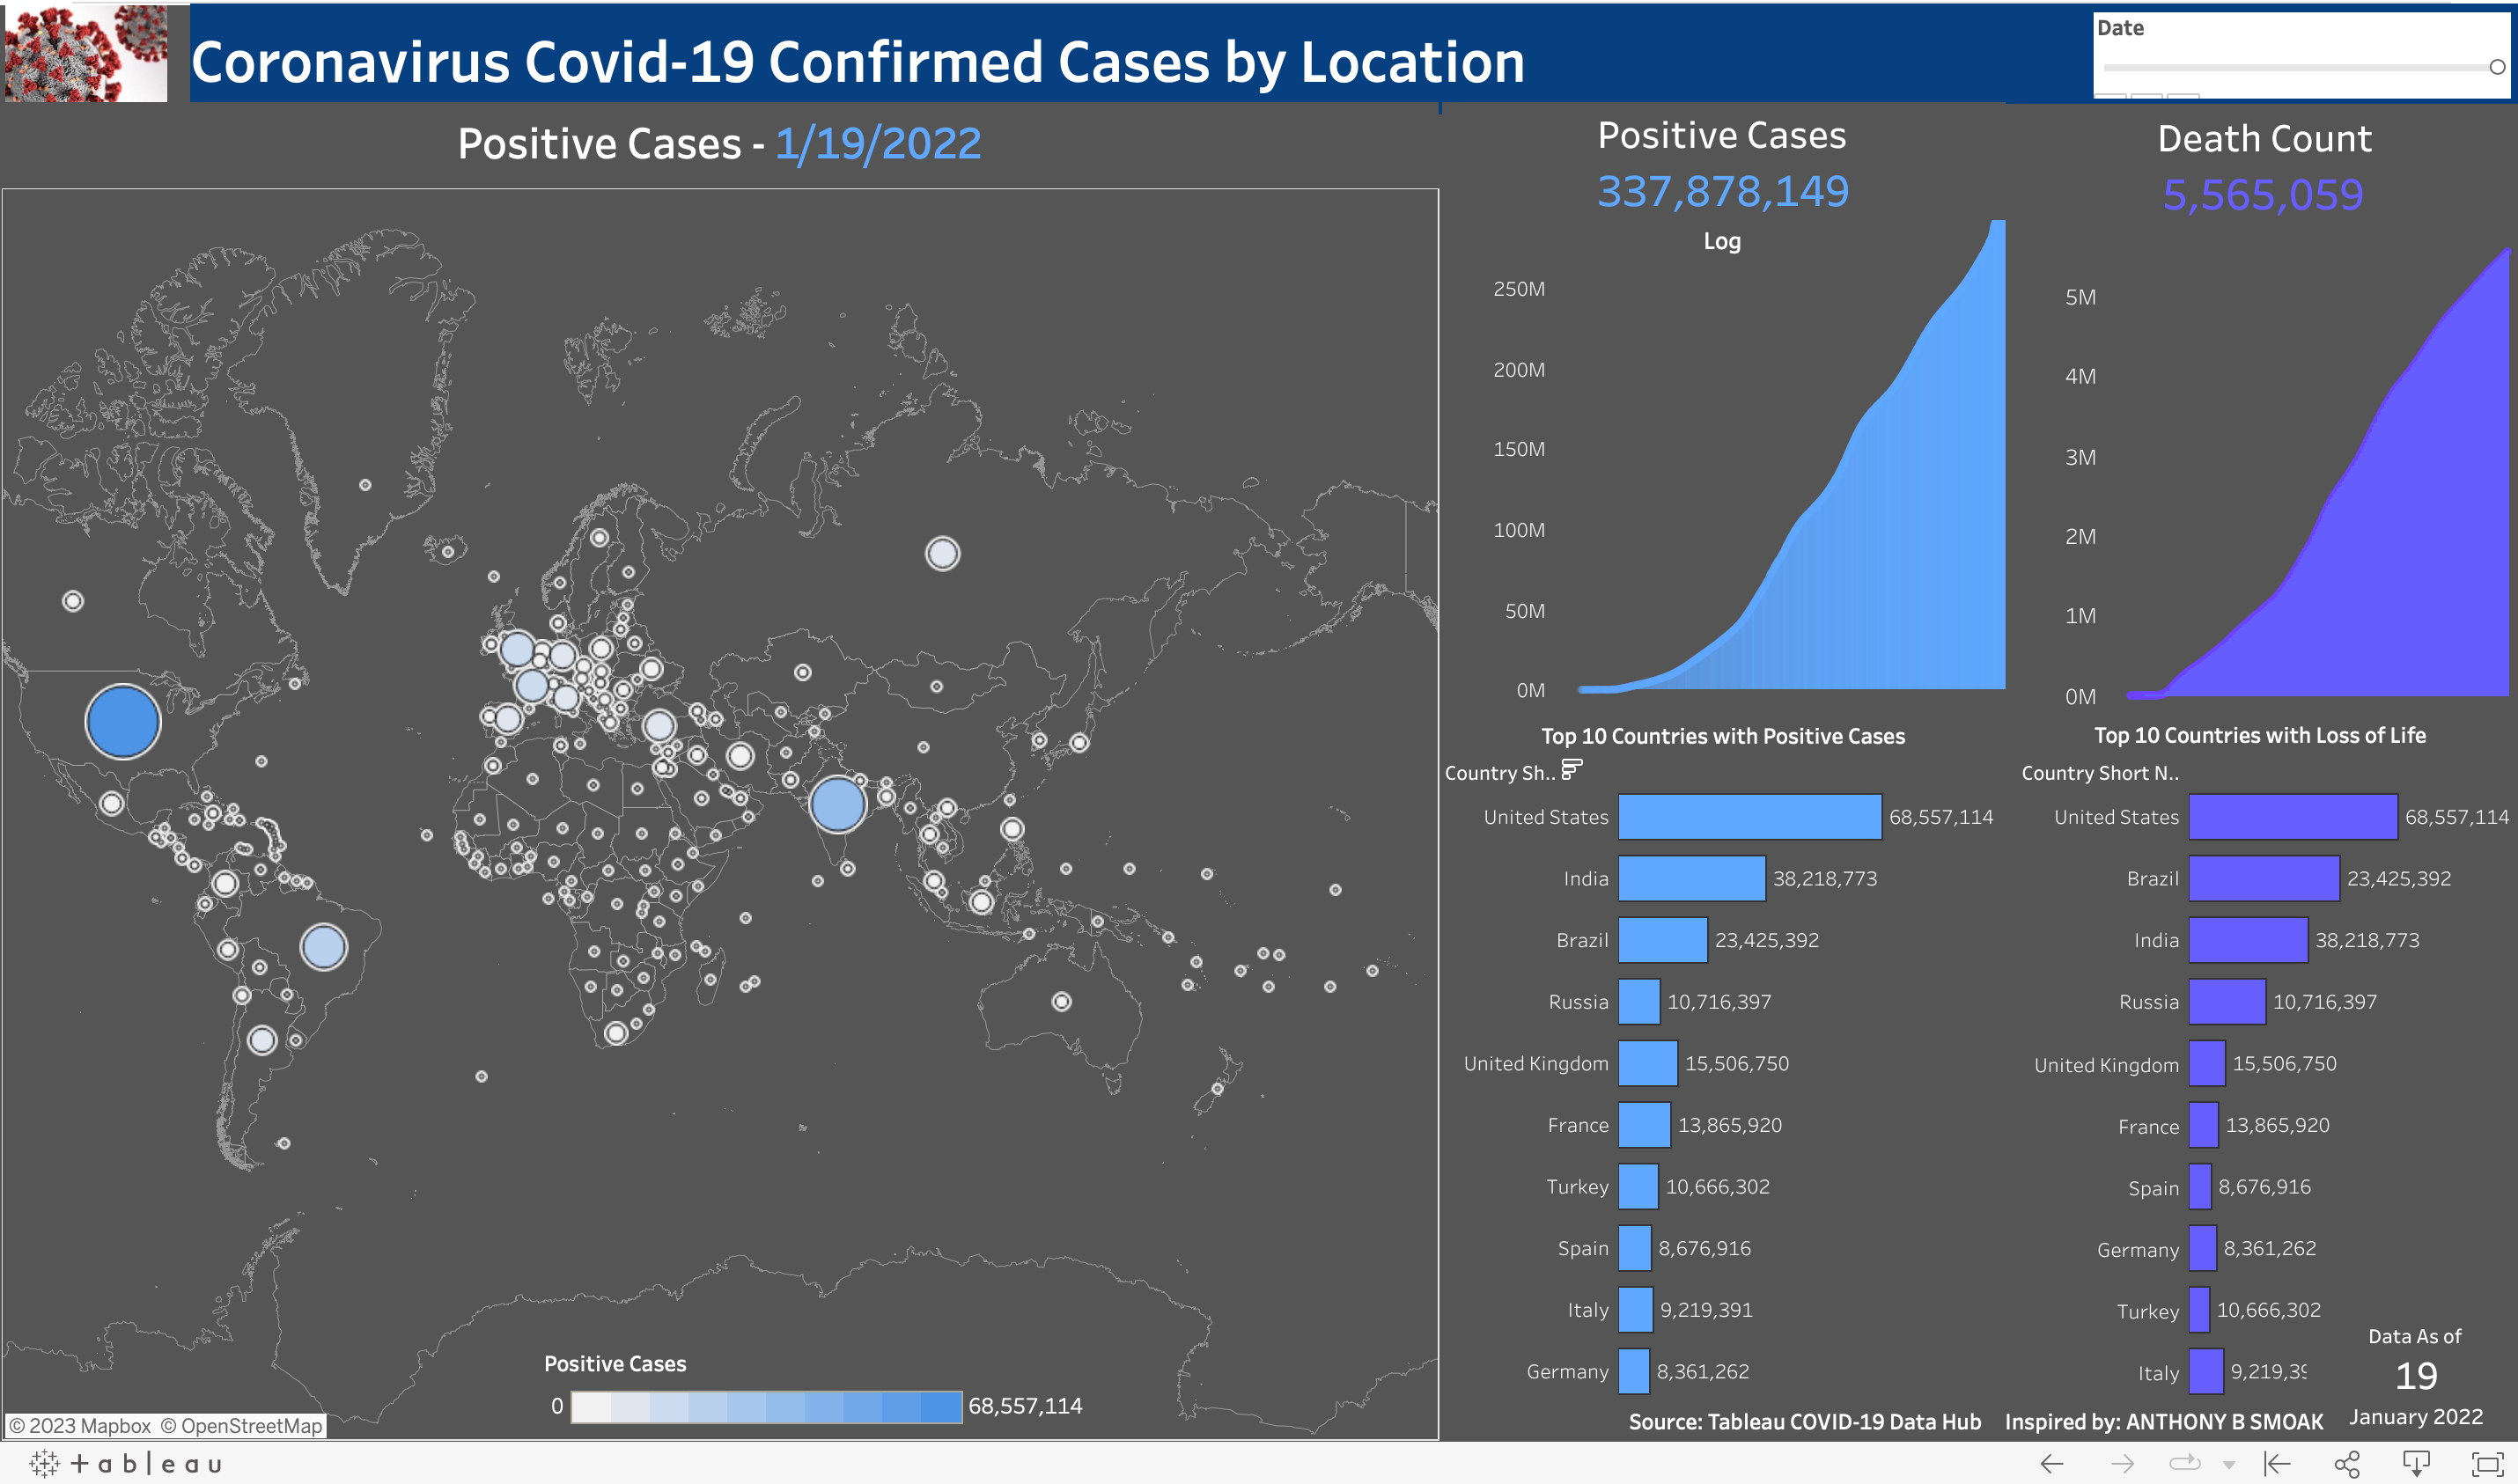
COVID-19 Worldwide Cases Synchronous Dashboard using Tableau

U.S. Multinational Corporation Trade Database with China
- Tools: SQL · Databases · MySQL
- The database aims to serve people interested in US-China trade war and its effect on US-China trade volumes, and the impact on US multinational corporations (MNCs) which depend on global value chains (GVC) heavily.
- The database provides mainly two types of data. The first type is the macroscopic data. Specifically, this database provides US-China monthly trade data by commodity, the volume and percentage of products under tariff data between US and China. It also contains the data about US annual trade with all countries and the basic development indicator information of these countries, including GDP, population, tariff rate in general, and tariff rate for manufactured products. The second type of data is the microcosmic data about MNCs, including S&P 500 company list with detailed information, such as stock symbol, location, sector, industry, etc., S&P 500 company stock price time-series data, fortune 500 company list and their annual revenues data, fortune 500 company stock price time-series data, top 20 companies list based on their level of sale in China, and top 20 companies list based on their share of sale in China.
- People could utilize this dataset to explore how U.S.-China trade relations change in the 21st century, the connection between U.S.-China trade and their tariff change, the differences in the tendencies of US trade with different companies, how U.S.-China trade relations affect U.S. multinational corporations (MNCs).
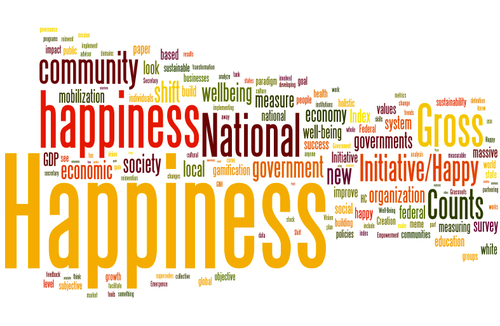
What Factors Affect People’s National Happiness Score?
- Tools: R · R Markdown
- The World Happiness Report is the most professional annual report about countries’ happiness index and has attracted attention from policymakers from multiple areas. The values of happiness scores are based on respondent ratings of their own lives. And each report also includes six basic factors covering financial generation, social back, life anticipation, flexibility, nonattendance of debasement, and liberality.
- This paper explores the effect of other potential factors, including regime type, demographic factors, and COVID-19 severity. The statistical findings indicate that the more democratic one country is, and the larger the population size, its citizens tend to feel happier. Besides, the population density, population net change, and population density net change are negatively correlated to one country’s happiness score.
- Two interesting findings through data visualization are: Firstly, the relationship between democracy and one country’s happiness index follows a U shape rather than a positive linear line, different from the statistical results and no support to H1. Secondly, the population size and population density are negatively related to one country’s happiness index, supporting H2a and H2b. The results indicate that statistical regression results are not reliable in all cases, and data visualization is necessary to examine and interpret the statistical regression results more accurately.
Skills
Programming Languages
 Java
Java
 HTML
HTML
 CSS
CSS
 JavaScript
Cloud Platforms
 AWS Web Services
 AWS Glue
 AWS Lambda
 AWS Boto3
 AWS S3
 AWS EC2
 AWS ECR
 AWS & OpenSearch
 Google CLoud
Web Frameworks
 Django
Data Application Frameworks
 Streamlit
 R Shiny
Database & Big Data
 SQL Server
Tools
 Jupyter Notebook
Libraries
 PyTorch
Certificates
 Graduate Certificate in Applied Machine Learning at UTD
 Google Data Analytics Certificate
 AWS Certified Cloud Practitioner Certificate
 Alteryx Designer Core Certificate
 Appian Certified Associate Developer
 ACCELQ Automation Engineer Certificate
Languages
 English
 Chinese
 Japanese
Education
The University of Texas at Dallas
Dallas, USA
Degree: Ph.D. in Political Science – Quantitative Statistical Modeling Focused
GPA: 3.95/4.0
Degree: Master of Science in Business Analytics (STEM) – Data Science & Data Engineer Track
GPA: 4.0/4.0
Degree: Master of Science in Social Data Analytics and Research
GPA: 3.95/4.0
Degree: Master of Art in Political Science
GPA: 3.95/4.0
Jinan, China
Degree: Master of Law in International Politics
GPA: 88.78/100
Degree: Bachlor of Arts in Japanese
GPA: 87.37/100