What Factors Affect People’s National Happiness Score?
Min Shi
December 7 2021
1 Abstract
The World Happiness Report is the most professional annual report about countries’ happiness index and has attracted attention from policymakers from multiple areas. The values of happiness scores are based on respondent ratings of their own lives. And each report also includes six basic factors covering financial generation, social back, life anticipation, flexibility, nonattendance of debasement, and liberality. However, the annual report has two limitations: factors included are limited and a lack of long-term analysis. This paper explores the effect of other potential factors, including regime type, demographic factors, and COVID-19 severity. The statistical findings indicate that the more democratic one country is, and the larger the population size, its citizens tend to feel happier. Besides, the population density, population net change, and population density net change are negatively correlated to one country’s happiness score. Two interesting findings through data visualization are: Firstly, the relationship between democracy and one country’s happiness index follows a U shape rather than a positive linear line, different from the statistical results and no support to H1. Secondly, the population size and population density are negatively related to one country’s happiness index, supporting H2a and H2b. The results indicate that statistical regression results are not reliable in all cases, and data visualization is necessary to examine and interpret the statistical regression results more accurately.
2 Introduction
Happiness has been a central tenet of Western culture since the days of Greek philosophers (Graham 2008). Although there are many definitions of happiness, generally, it could be defined as an abstract and subjective assessment of oneself or the holistic assessment of one’s entire life (Veenhoven 2008). Happiness is often described as the main aim of life and an individual’s drive for personal fulfillment (Scoffham and Barnes 2011, Weech-Maldonado R. et al. 2017).
Nowadays, as mental health becomes one common societal issue, people’s well-being has attracted policymakers worldwide. Happiness is not a purely personal issue; it is strongly determined by the society they live in (Frey & Stutzer 2002: p. vii). On the one hand, some reported satisfaction with life across countries is positively correlated with average income. In other words, people in richer countries are likely to be happier than those in poor countries in a long term (Easterlin et al. 2010). On the other hand, there are also findings showing that income inequality, perceived unfairness, and lack of trust rather than the income level lead to more negative effects on people’s well-being (Oishi et al. 2011). Besides, Cheng et al. (2014) find more factors, including universal disposition, cultural self-construal, and national income can elucidate differences in subjective well-being through a multilevel structural equation model. Moreover, Cordero et al. (2017) claim that age, marital status, religion, and unemployment, these kinds of traditional determinants also significantly impact on efficiency of converting resources into a higher level of happiness. The arguments indicate that the factors affecting people’s well-being and the ability to transfer resources into higher level happiness are complex.
3 World Happiness Report
The most professional report about states’ happiness index is the World Happiness Report, distributed annually by the United Nations Sustainable Development Solutions Network based on respondent ratings of their own lives. The happiness index correlates with various life factors, such as financial generation, social back, life anticipation, flexibility, nonattendance of debasement, and liberality. The original dataset for the report provides a populated-weighted average score on a scale running from 0 to 10 for each of the variables from these six aspects, including 1) real GDP per capita, 2) social support, 3) healthy life expectancy, 4) freedom to make life choices, 5) generosity, 6) perceptions of corruption.
World happiness report is a landmark survey of the state of global happiness and has attracted more and more attention from policymakers from many areas, including the governments, organizations, and civil society, etc. But there are two limitations of their report. Firstly, the factors listed in the report are not comprehensive. This research will explore the other factors that are not listed in the World Happiness Report and have imposed an effect on the people’s national happiness index, such as democracy level, demographic factors, Covid-19 severity (during 2020) using OLS regression models. Secondly, the annual report is based on the nearest two- or three-year data rather than panel data so that it lacks long-term analysis of the correlation between social factors with happiness scores. Thus, this research will build several fixed-effect regression models based on newly generated panel datasets to increase the validity of regression results.
In this research, I would like to explore the following questions:
Firstly, does the democracy level influence country’s happiness index?
Secondly, do the demographic factors, such as population density, population net change, and net migrants impact the national happiness score?
Thirdly, since the first identification coronavirus case in December 2019, the virus has taken the world by storm. Besides the economic impact, the pandemic period greatly impacts people’s mental health, which could not be overlooked. Thus, what are the effects of the mortality due to Covid-19 and the index of exposure to COVID-19 infections in other countries on people’s national happiness index in 2020?
4 Democracy and Happiness
Different scales of democracy will reflect the political environment inside the country. It could indicate people’s freedom to make life choices to some degree and indicate citizens’ political freedom. In a complete autocracy with the lowest democracy level, there are no multiparty elections for the chief executive or the legislature in one country (e.g., North Korea since 1945). In some electoral autocracy, which has a relatively low level of democracy (e.g., Iran since 1980, Pakistan since 2002, Turkey since 2014, etc.), even there are multiparty elections, but the elections are unfair and not free, or no multiparty elections. In some incomplete democracies with a middle level of democracy, citizens have free and fair multiparty elections in reality, but either access to justice, or transparent law enforcement, or liberal principles of respect for personal liberties, the rule of law, and judicial as well as legislative constraints on the executive are not satisfied (e.g., India since 1952 (except for 1975 and 1976), Peru during 1981-1991 and 2001-till date, Argentina since 1984, Mexico since 1995, etc.). In liberal democracy with the highest democracy level, citizens have free and fair multiparty elections and have access to justice, transparent law enforcement, and the liberal principles of respect for personal liberties, the rule of law, and judicial as well as legislative constraints on the executive (e.g., Australia since 1901, most of the European countries, United States, Canada, and Japan in the modern periods) (Coppedge et al. 2020, p. 266). Generally, when the democracy level is higher, people will feel more satisfied since they feel more engaged in political decision-making. Here comes the first hypothesis as follows:
H1: More democratic a country’s regime type is, the higher the happiness score the country will have.
5 Demographic Factors and Happiness
Research focusing on socio-demographic factors finds that socio-demographic differences, such as gender, age, race, income, education, etc., can impact an individual’s level of happiness (Kim-Prieto et al. 2005). When comparing the population size, population density, and net population change across countries, the number of net immigrants might affect people’s satisfaction with the living environment. Specifically, in the countries with a similar amount of natural resources, economic capacity, and economic growth rate, the ones with larger population size, higher population density, rapid population net change, and higher Index of the net immigrant will have fewer natural and social resources per capita and the tendency will put more pressure on citizens so that their perception of a future life will be less likely be better compared to the people living in the other countries with smaller population size, lower population density, slow population net change, and lower Index of a net immigrant.
Thus, here come the second hypotheses:
H2a: Population size is negatively correlated with happiness index.
H2b: Population density is negatively correlated with happiness index.
H2c: Population net change is negatively correlated with happiness index.
H2d: The number of net migrants is negatively correlated with the happiness index.
H2e: Population density net change is negatively correlated with happiness index.
6 The Pandemic and Well-being
COVID-19, which was first discovered and reported in Wuhan, China, in December 2019, spread worldwide at a fast and terrifying pace throughout 2020. The pandemic has affected many key aspects of life around the world. The most severe impact of the pandemic is the 2 million deaths from COVID-19 in 2020. The nearly 4 percent annual increase in deaths worldwide represents a serious loss of social welfare. In terms of life, financial insecurity, anxiety, disruption in every aspect of life, stress, and challenges to mental and physical health for many people (World Happiness Report, 2021, p. 7). Countries with the highest deaths also had the greatest falls in GDP per head (p. 8). Thus, COVID-19 deaths in 2020 and an Index of exposure to COVID-19 infections in other countries might harm people’s happiness index.
Here is the third hypothesis as follows:
H3: The serious the pandemic in one country, measured by COVID-19 deaths per 100,000 population in 2020 and Index of exposure to COVID-19 infections, the more decrease in the country’s happiness index at the same year.
7 Datasets
The new datasets include Dataset 1 based on World Happiness Report 2020 and 2021 and Dataset 2 based on World Happiness Report Panel Data during 2005-2020.
7.1 Dataset 1 based on World Happiness Report 2020 and 2021
This dataset is generated from the following five datasets:
7.1.1 World Happiness Report 2020 – Data for Figure 2.1 and World Happiness Report 2021 – Data for Figure 2.1
Each dataset is based on the surveys collected from over 150 countries. The 2020 dataset features the happiness score averaged over the years 2017–2019, and the 2021 one features the happiness score averaged over 2018–2020. I have merged the two datasets and have built the difference in happiness score, difference in logged GDP per capita, difference in social support, difference in healthy life expectancy, difference in freedom to make life choices, difference in generosity, and difference in perceptions of corruption seven variables. The main variable happiness Score and the new generated difference in happiness score will be the dependent variables in my research. The Happiness Score is a national average of the responses to the main life evaluation question in the Gallup World Poll (GWP), which uses the Cantril Ladder. There are also six variables correlated to happiness score, each of which is measured reveals a populated-weighted average score on a scale running from 0 to 10, including 1) real GDP per capita, 2) social support, 3) healthy life expectancy, 4) freedom to make life choices, 5) generosity, 6) perceptions of corruption. These six metrics are used to explain the extent to which each factor contributes to increased life satisfaction when compared to the hypothetical nation of Dystopis, which represents the lowest national averages for each key variable.
7.1.2 Polity IV Dataset
The Polity5 dataset covers all major, independent states in the global system from 1800-2018 (Marshall and Gurr 2020). I will utilize the Polity2 variable to measure one state’s democracy. The Polity conceptual scheme is unique because it examines concomitant qualities of democratic and autocratic authority in governing institutions rather than discreet and mutually exclusive forms of governance. This perspective envisions a spectrum of governing authority that spans from fully institutionalized autocracies through mixed, or incoherent, authority regimes (termed “anocracies”) to fully institutionalized democracies. The “Polity Score” captures this regime authority spectrum on a 21-point scale ranging from -10 (hereditary monarchy) to +10 (consolidated democracy). The Polity scores can also be converted into regime categories in a suggested three-part categorization of “autocracies” (-10 to -6), “anocracies” (-5 to +5 and three special values: -66, -77 and -88), and “democracies” (+6 to +10).
7.1.3 Population by Country – 2020
This dataset was created by Tanu N Prabhu using web scraping based on the data shown on the website named worldometer, which is a real-time monitoring and reporting website about the world and national population from many demographic aspects. The dataset is posed on the Kaggle website, containing the variables Population (2020), Density (P/Km2), Land Area (Km²), Population Net Change, and Migrants (net) I want to use to explore the impact of demographic factors on Happiness Score.
7.1.4 World Happiness Report 2021 – Mortality Dataset
This dataset is downloaded from the World Happiness Report 2021 website and has been included as the appendices data to explore the effect of COVID-19 on people’s well-being. There are several variables to measure the COVID-19. I utilize the COVID-19 deaths per 100,000 population in 2020 and Index of exposure to COVID-19 infections in other countries to explore how COVID-19 affects people’s well-being in 2020. This dataset also includes the population of 2019 and 2020, used to generate the population density in 2019 combined with the variables in the population dataset.
7.2 Dataset 2 based on World Happiness Report Panel Data during 2005-2020
This dataset is generated from the following four datasets:
7.2.1 World Happiness Report 2021– Data Panel
Like each World Happiness Report 2021 dataset, it is based on the survey collected from people in over 150 countries. The period of the panel data is from 2005 to 2020. Besides the main variable happiness Score, there are also six variables correlated to happiness score – real GDP per capita, social support, healthy life expectancy, freedom to make life choices, generosity, and perceptions of corruption.
7.2.2 Polity IV Dataset
The same dataset as the one used in Dataset 1 with the same name; see data descriptions above.
7.2.3 World Development Indicators – Population
This dataset is downloaded from the World Bank. Its period is from 2004 to 2020, and it includes the data of 236 countries and dependencies. The population variable measures the total population size. In other words, it counts all residents regardless of legal status or citizenship.
7.2.4 World Development Indicators – Population Density
This dataset is also downloaded from the World Bank. The period of the dataset is from 2004 to 2020. And it includes the population density data of 236 country and dependencies. As for the population density variable, its unit is people per sq. km of land area.
8 Research Method
8.1 Data collection
In this research, I build two datasets – Dataset 1 based on World Happiness Report 2020 and 2021, and Dataset 2 based on World Happiness Report Panel Data during 2005-2020. I use Pandas and NumPy packages in python to clean, merge, sort the datasets. I build several new variables to measure the differences in happiness score, GDP per capita, social support, healthy life expectancy, freedom to make life choices, generosity, perceptions of corruption, democracy, population, and population density between 2019 and 2020 in Dataset 1. I also use diff() function to generate the first difference for all variables in Dataset 2. Considering the lag effect of the explanatory variables on the dependent variables, all explanatory variables are one year lagged in the datasets lagged for endogeneity concerns.
8.2 Statistical Tests
Based on Dataset 1, I build five OLS linear regression models to test the factors affecting country’s happiness score in 2020 and differences in happiness score between 2018-2020 and 2017-2019 periods. Based on Dataset 2, I first build two fixed-effect regression models to test the factors affecting people’s national happiness scores by fixed year effect. Then I build two first-difference regression models to test the correlation between the first difference in every explanatory variable and the first difference in happiness score.
8.3 Data Visualization
To visualize the correlation between the explanatory variables with the happiness score, and the first difference in the explanatory variables with the first difference in happiness score, I use R, shiny, and Dashboard to plot the histogram of variables used in the two datasets, the scatter plots with regression lines, etc.
9 Results
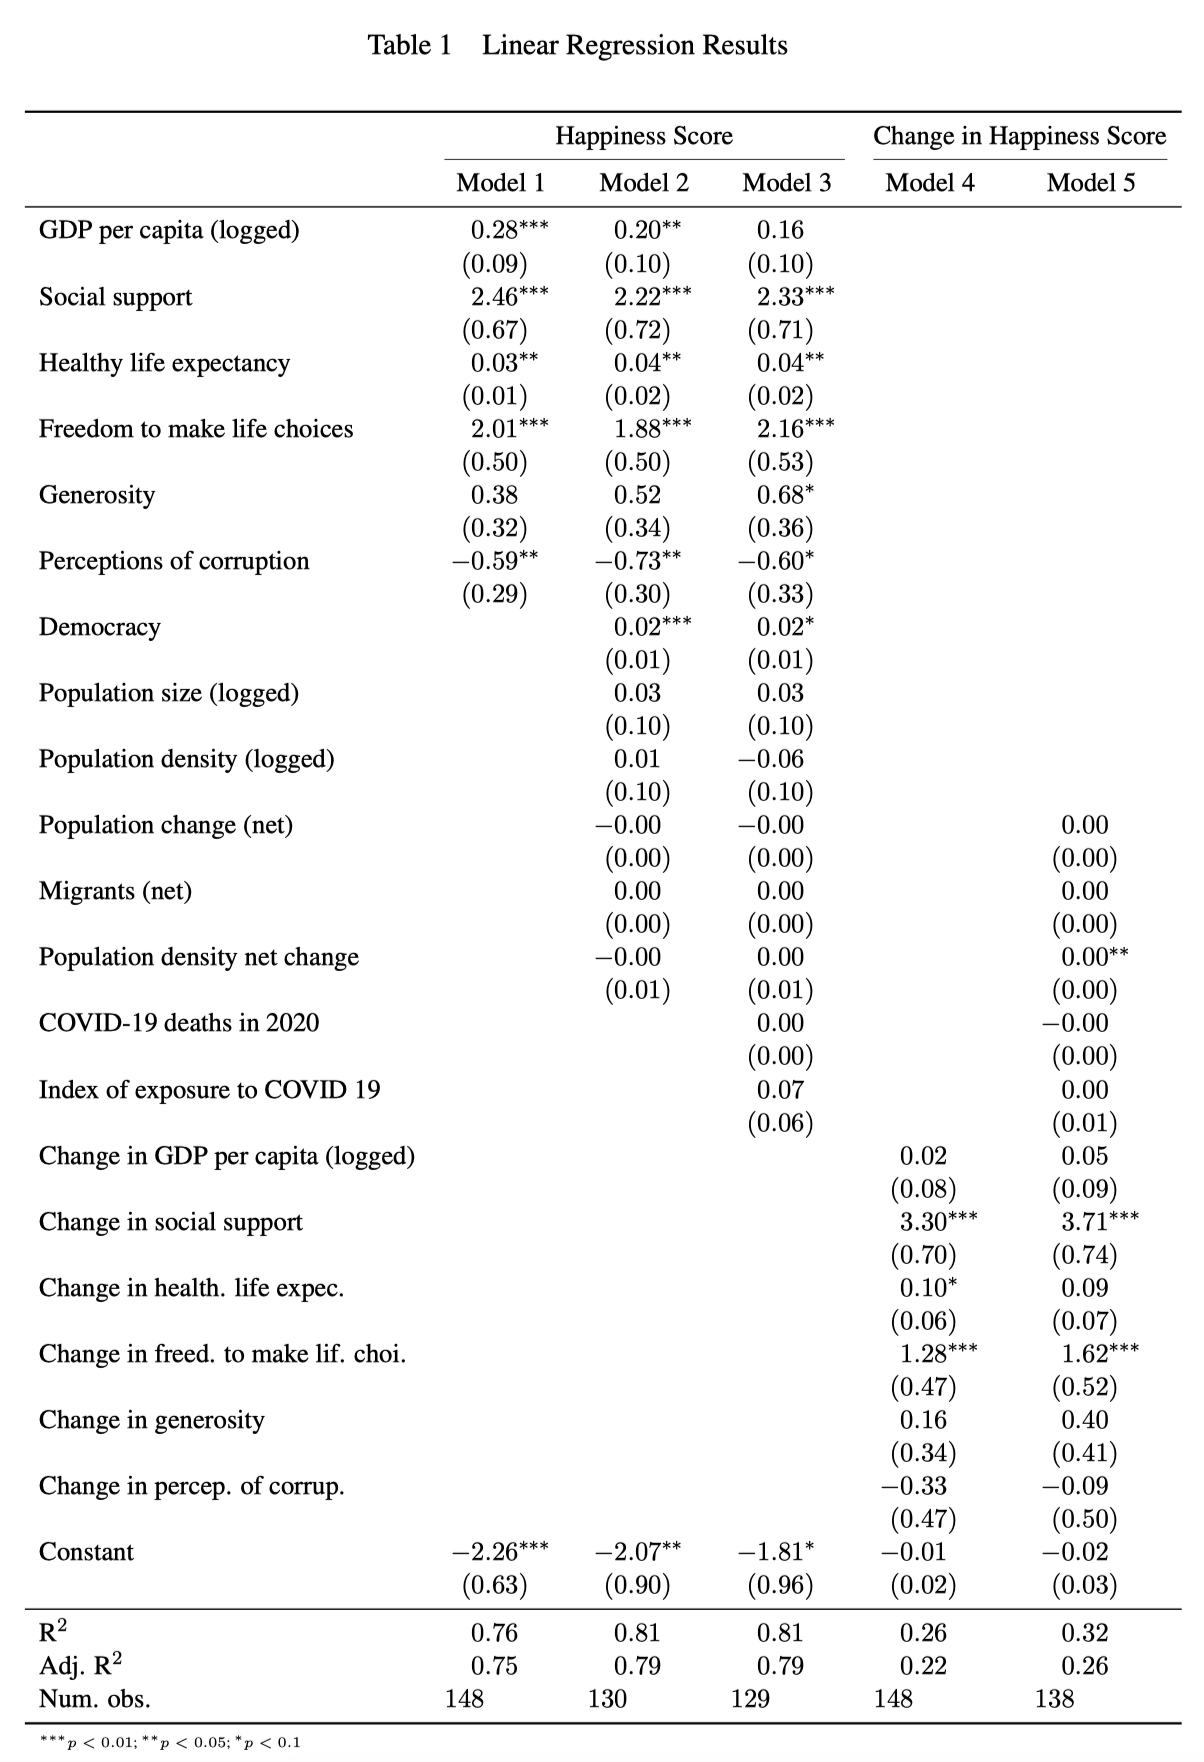
 Table 1 shows the statistical results of five linear regression models. In models 1-3, I use the Happiness Score in the 2021 report as the dependent variable. Model 1 is the basic model which contains the six factors included in the World Happiness Report 2021, including 1) GDP per capita, 2) social support, 3) healthy life expectancy, 4) freedom to make life choices, 5) generosity, 6) perceptions of corruption. Model 2 contains the democracy variable and five demographic variables, including population size (logged), population density (logged), population change (net), migrants (net), population density net change besides the six basic variables included in Model 1. Model 3 includes two variables measuring the severity of COVID-19 – COVID-19 deaths per 100,000 population in 2020 and the Index of exposure to COVID-19 infections in other countries besides the variables in Model 2.
In models 4-5, I use Change in Happiness Scores in the 2021 report compared to those in the 2020 report as the dependent variable. In other words, I use the difference in average happiness score during 2018-2020 and average happiness score during 2017-2019 as DV. As for the explanatory variables, I have included change in GDP per capita (logged), change in social support, change in healthy life expectancy, change in freedom to make life choices, change in generosity, change in perceptions of corruption, and change in population density between 2019 and 2020 in Model 4. I have added three demographic variables – population change (net), migrants (net), and population density net change and two COVID-19 severity measurement variables – COVID-19 deaths per 100,000 population in 2020 and Index of exposure to COVID-19 infections in other countries in Model 5 besides the variables included in Model 4.
As shown in Table 1, Model 1 provides support to the correlations between the five factors included in the World Happiness Report 2021. Specifically, there are positive correlations between the variables – GDP per capita (logged), social support, healthy life expectancy, freedom to make life choices, and the dependent variable happiness score; And there is a negative correlation between perceptions of corruption and happiness score. However, there is no statistical significance for the coefficient of generosity. Model 2 shows a similar relationship between happiness score and the basic six factors, as shown in Model 1. Besides, the coefficient of democracy is positively significant at a 99% confidence level, indicating that higher democracy has a positive effect on happiness score and supports H1. However, the coefficients of the demographic variables in Model 2 are all non-statistically significant. According to Model 3, similarly, democracy is positively correlated with happiness score at the 90% confidence level, supporting H1. Besides, there is no statistical significance of demographic variables. Also, two Covid-19 severity variables are not statistically significant. However, generosity is positively correlated with the happiness score in Model 3.
Thus, we could say that the improvement in the economy, social support, healthy life expectancy, freedom to make life choices, and generosity could positively affect people’s well-being. At the same time, the increase of perceptions of corruption could negatively impact people’s well-being. Democracy level is positively correlated to happiness score, while the demographic factors do not have an obvious relationship with happiness score based on the 2020 dataset.
According to the regression results of Model 4, change in social support, change in healthy life expectancy, and change in freedom to make life choices are positively statistically significant, showing that the improvement in social support, healthy life expectancy, and the freedom in making life choices could be good for increasing people’s happiness index in 2020. In Model 5, change in social support and the freedom to make life choices are still statistically significant. Still, there is no evidence to show the effect of both demographic and Covid-19 severity variables. Combining the results of Model 4 and Model 5, we could summarize that change in social support plays the most significant role in improving people’s well-being in 2020. Besides, improving people’s healthy life expectancy and providing more freedom are also good choices to improve people’s well-being.
Overall, we could conclude that GDP per capita (logged), social support, healthy life expectancy, freedom to make life choices, generosity, and democracy level positively correlate to one country’s average happiness index. Improvement in social support, healthy life expectancy, and freedom to make life choices could positively affect people’s well-being. All demographic variables and COVID-19 severity variables have no significant effect on either the happiness index or the change in the happiness index. However, adding demographic variables increases R2 and adjusted R2 to some degree, indicating some correlation between demographic variables and the country’s happiness index. I turn to Dataset 2 – the panel data and build more regression models to further explore the effect of demographic variables.
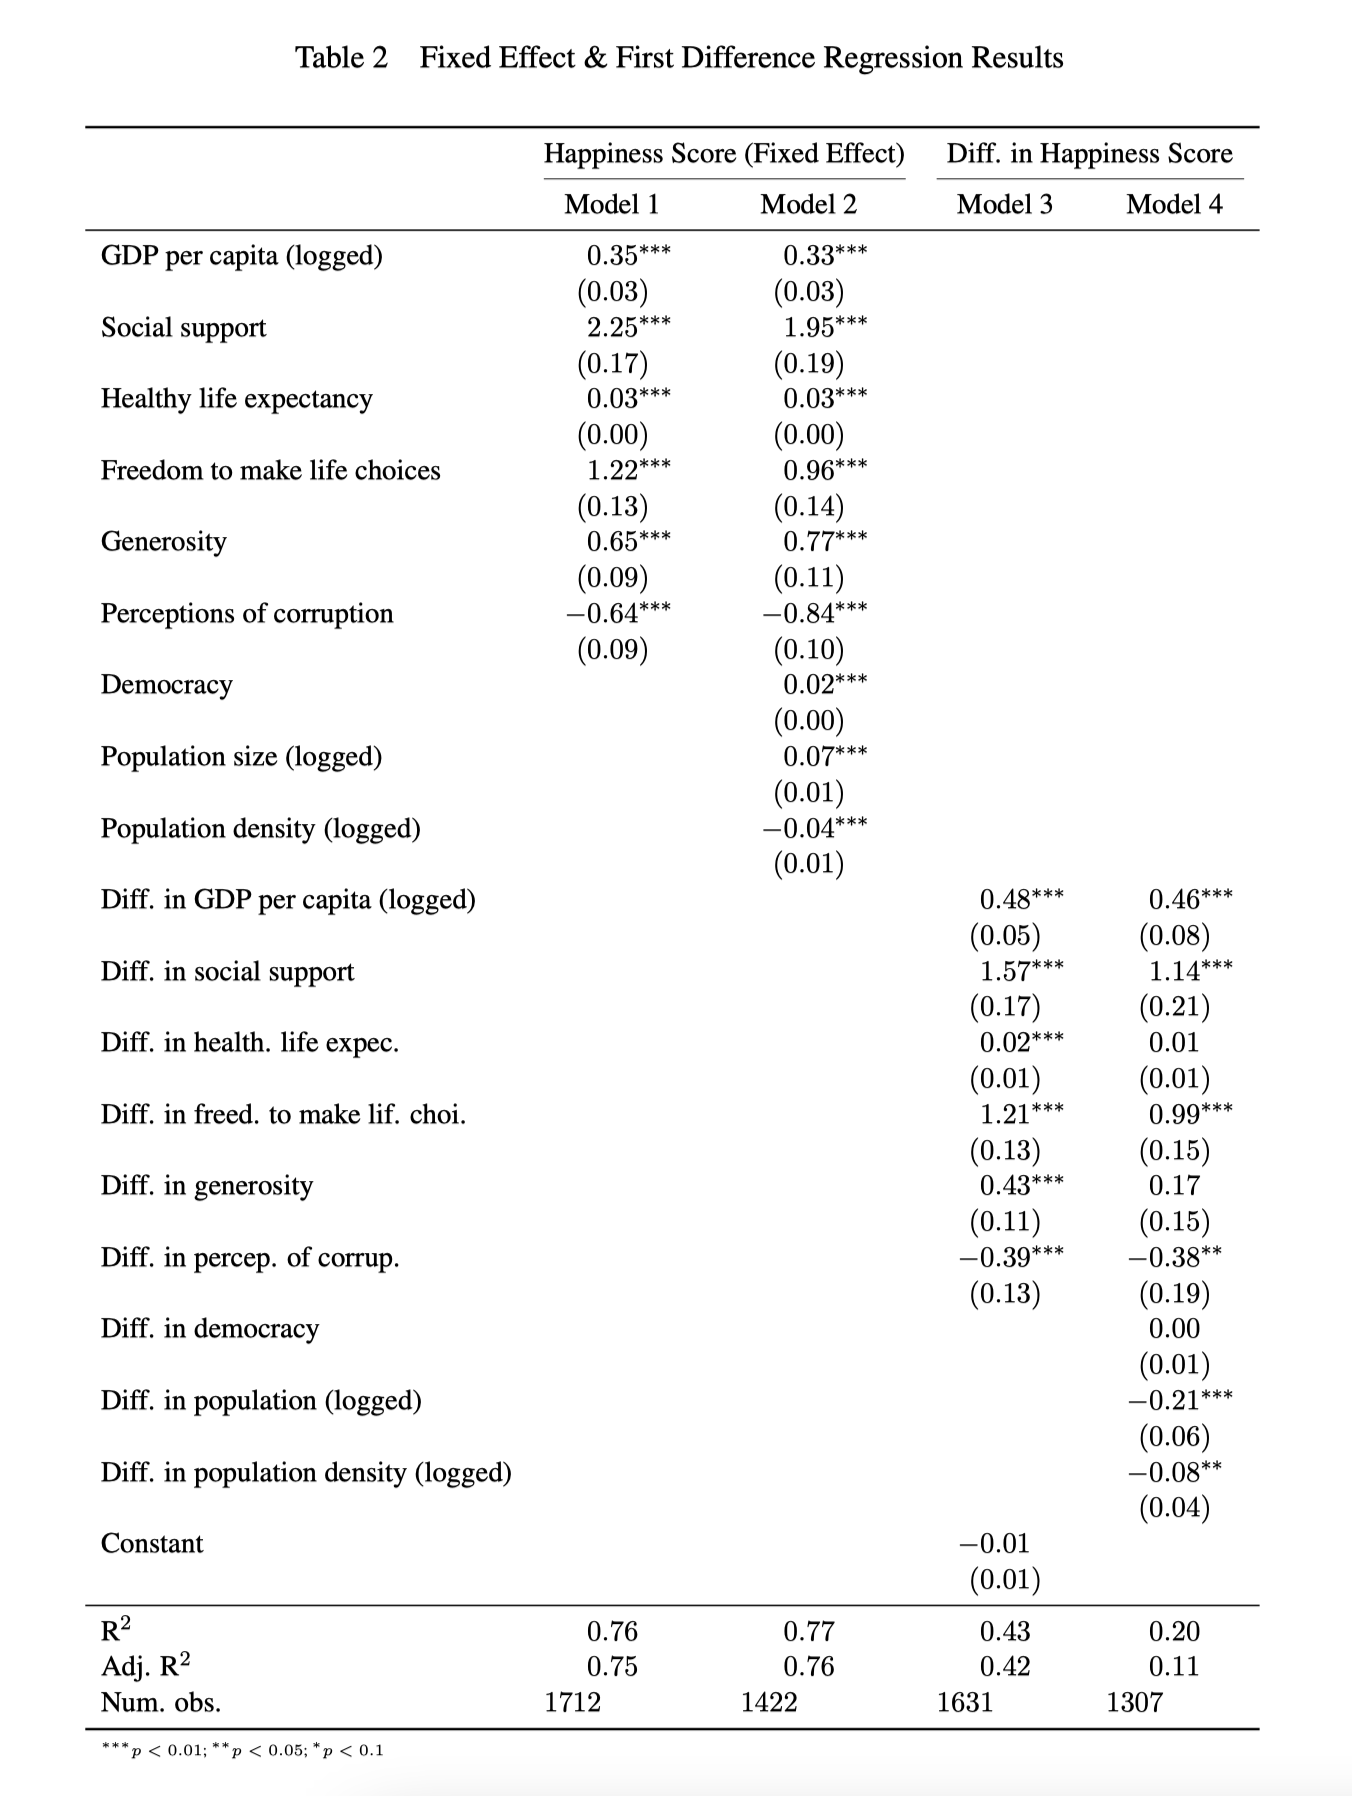
 Table 2 shows the statistical results of two fixed effects and two first difference regression models using the panel data. In models 1 and 2, I use Happiness Score as the dependent variable. Model 1 includes the six basic factors. Model 2 adds democracy variable and two demographic variables – population size (logged) and population density (logged). In models 3 and 4, I use the Difference in Happiness Score as the dependent variable. In Model 3, the explanatory variables are the first difference of the six basic factors, including difference in GDP per capita (logged), difference in social support, difference in healthy life expectancy, difference in change in freedom to make life choices, difference in generosity, difference in perceptions of corruption, and difference in population density. Model 4 add difference in democracy, difference in population, and difference in population density based on Model 3.
Model 1 provides support to the correlations between the six factors included in the World Happiness Reports. Specifically, the first five explanatory variables – GDP per capita (logged), social support, healthy life expectancy, freedom to make life choices, and generosity are positively related to the dependent variable happiness score; And perceptions of corruption are negatively related to happiness score. Model 2 shows a similar relationship between happiness score and the basic six factors, as shown in Model 1. Besides, the coefficient of democracy is positively significant at a 99% confidence level, showing that the higher level of democracy, the higher the happiness score holding the other factors constant, providing support to H1. Moreover, population size is positively correlated to happiness score at the 99% confidence level, against H2a. And population density is negatively related to happiness score at 99% confidence level, supporting H2b. In Model 3, the results show a similar tendency as shown in the first two fixed-effect models. The results in Model 4 provide a further meaningful reference for H2. The coefficients of difference in population and difference in population density are negatively statistically significant, providing support to H2c and H2e.
In a nutshell, we could conclude that GDP per capita (logged), social support, healthy life expectancy, freedom to make life choices, generosity, and democracy level are positively correlated to one country’s average happiness index. And the relationship holds when taking the first differences of the six variables and the happiness score. Democracy level is positively correlated to happiness score, providing support to H1. As for demographic variables, population density is negatively correlated to the happiness score, supporting H2b. Change in population size, and change in population density are negatively related to the differences in happiness score, supporting H2c and H2e. But population size is positively related to happiness score, which is against H2a. Besides, there is no findings for H2d and H3.
10 Data Visualization
10.1 Dataset 1 based on World Happiness Report 2020 and 2021
10.1.1 WHS ~ Logged GDP per capita
Consistent with the positive coefficient of GDP per capita in Models 1-2 shown in Table 1, the smooth regression line above also indicates the positive correlation between Logged GDP per capita and the country’s happiness score.
10.1.3 WHS ~ Healthy Life Expectancy
Consistent with the positive coefficient of Healthy Life Expectancy in Models 1-3 shown in Table 1, the smooth regression line above also indicates the positive correlation between Healthy Life Expectancy and the country’s happiness score.
10.1.4 WHS ~ Freedom to make life choices
Like the tendency shown in Models 1-3 shown in Table 1, the smooth regression line above indicates the positive correlation between Freedom to make life choices and the country’s happiness score.
10.1.5 WHS ~ Generosity
According to Models 1-3 shown in Table 1, generosity is only significant in Model 3, with a positive sign. In the scatter plot above, the smooth regression line indicates the relationship between generosity and the country’s happiness score is not obvious.
10.1.6 WHS ~ Perceptions of corruption
Consistent with the tendency shown in Models 1-3 shown in Table 1, the smooth regression line above indicates the negative correlation between Perceptions of corruption and the country’s happiness score.
10.1.7 WHS ~ Regime Type
Different from the positive coefficient of Democracy shown in Models 2-3 of Table 1, the smooth regression line above indicates Democracy and the country’s happiness score follow a U-shape relationship.
10.1.8 WHS ~ Regime Type by Region
The linear regression lines of the country’s happiness score on democratic level by region indicate that when holding democracy level the same, the average happiness score in different regions are different. Specifically, North America (located in the upper top corner) and Western Europe (shown in pink line) have the highest happiness score while South Asia and Sub-Saharan Africa have the relatively lowest happiness score. Central and Eastern Europe, Latin America and Caribbean, East Asia, Southeast Asia, Commonwealth of Independent States, Middle East and North Africa rank in the middle.
10.1.9 WHS ~ Population in 2020 (logged)
Different from the non-significance of the coefficients of Population in 2020 (logged) shown in Models 2-3 of Table 1, the smooth regression line above shows that Population in 2020 (logged) is negatively related to the country’s happiness score, meaning the larger the population size, the lower of one country’s happiness score.
10.1.10 WHS ~ Population Density (logged P/Km²)
Similar with the non-significance of the coefficients of Population Density (logged P/Km²) shown in Models 2-3 of Table 1, the smooth regression line also shows that there is no obvious relationship between Population Density (logged P/Km²) and the country’s happiness score.
10.1.11 WHS ~ Population Net Change (logged)
Different from the non-significance of the coefficients of Population Net Change (logged) shown in Models 2-3 of Table 1, the smooth regression line above shows that Population Net Change (logged) is negatively related to the country’s happiness score, meaning when one country’s population increasing speed is quicker, the people living in that country will be less happy.
10.1.12 WHS ~ Net Migrants (logged)
Same with the non-significance of the coefficients of Net Migrants (logged) shown in Models 2-3 of Table 1, the smooth regression line also shows that there is no obvious relationship between Net Migrants (logged) and the country’s happiness score.
10.1.13 Change in WHS ~ Change in GPD per capita (logged)
Consistent with the non-significance of the coefficients of Change in GPD per capita (logged) shown in Models 4-5 of Table 1, the smooth regression line also shows that there is no obvious relationship between Change in GPD per capita (logged) and change in one country’s happiness score.
10.1.15 Change in WHS ~ Change in Healthy Life Expectancy
Same with the slightly positive relationship between Change in Healthy Life Expectancy and Change in Happiness Index shown in Models 4-5 of Table 1, the smooth regression line above also shows that the relationship between the two variables follows a slightly positive regression line.
10.1.16 Change in WHS ~ Change in Freedom to Make Life Choice
Consistent with the positive relationship between Change in Freedom to Make Life Choice and Change in Happiness Index shown in Models 4-5 of Table 1, the smooth regression line above also shows that the two variables are highly positively correlated.
10.1.17 Change in WHS ~ Change in Generosity
Same with the non-significant coefficient of Change in Generosity shown in Models 4-5 of Table 1, the smooth regression line above also shows the effect of Change in Generosity on countries’ happiness index is not obvious.
10.1.18 Change in WHS ~ Change in Perceptions of Corruption
Inconsistent with the non-significance coefficient of Change in Perceptions of Corruption shown in Models 4-5 of Table 1, the smooth regression line above shows that the two variables are highly negatively correlated.
10.1.19 WHS ~ Population Density Net Change (logged)
Same with the no effect of Population Density Net Change (logged) shown in Models 4-5 of Table 1, the smooth regression line above also could not represent a clear relationship between Population Density Net Change (logged) and countries’ happiness index.
10.1.20 WHS ~ Migrants Net Change (logged)
Similar with the no effect of Migrants Net Change (logged) shown in Models 4-5 of Table 1, the scatter plot and smooth regression line above also could not show a clear effect of Migrants Net Change (logged)on countries’ happiness index.
10.1.21 WHS ~ COVID-19 deaths per 100,000 population in 2020
10.1.22 WHS ~ Index of exposure to COVID-19 infections in other countries
The two scatter plots above show that COVID-19 severity variables have no obvious effect on countries’ happiness index, consistent with the statistical regression results shown in Table 1.
10.2 Dataset 2 based on World Happiness Report Panel Data during 2005-2020
10.2.1 Line Plot showing the Values of Each Variable during 2005-2020
The line plot below shows that the values of most of the explanatory and development variables do not change a lot in the past 15 years (except for “polity2” – democracy level).

10.2.2 Scatter Plot: WHS ~ Logged GDP per capita
Consistent with the positive coefficient of GDP per capita in Models 1-2 shown in Table 2, the smooth regression line below also indicates an obvious positive correlation between Logged GDP per capita and the country’s happiness score.

10.2.3 Scatter Plot: WHS ~ Social Support
Same with the tendency shown in Models 1-2 shown in Table 2, the smooth regression line below indicates the positive correlation between Social Support and the country’s happiness score.

10.2.4 Scatter Plot: WHS ~ Healthy life expectancy at birth
Consistent with the positive coefficient of Healthy Life Expectancy in Models 1-2 shown in Table 2, the smooth regression line below also indicates the positive correlation between Healthy Life Expectancy and the country’s happiness score.

10.2.5 Scatter Plot: WHS ~ Freedom to make life choices
Like the tendency shown in Models 1-2 shown in Table 2, the smooth regression line below indicates the positive correlation between Freedom to make life choices and the country’s happiness score.

10.2.6 Scatter Plot: WHS ~ Generosity
According to Models 1-2 shown in Table 2, generosity is only significant in Model 3, with a positive sign. In the scatter plot below, the smooth regression line indicates the relationship between generosity and the country’s happiness score is not obvious. 
10.2.7 Scatter Plot: WHS ~ Perceptions of corruption
Consistent with the tendency shown in Models 1-2 shown in Table 2, the smooth regression line below indicates that there is a negative correlation between Perceptions of corruption and the country’s happiness score.

10.2.8 Scatter Plot: WHS ~ Democracy
Different from the positive coefficient of Democracy shown in Model 2 of Table 2, the smooth regression line below indicates Democracy and the country’s happiness score follow a U-shape relationship.

10.2.9 Scatter Plot: WHS ~ Population Size (logged)
Different from the positive sign of the coefficients of Population in 2020 (logged) shown in Model 2 of Table 2, the smooth regression line below shows that Population in 2020 (logged) is negatively related to the country’s happiness score. 
10.2.10 Scatter Plot: WHS ~ Population Density (logged)
Different from the negative sign of the coefficients of Population Density (logged P/Km²) shown in Model 2 of Table 2, the smooth regression line below shows that Population in 2020 (logged) is slightly positive related to the country’s happiness score. 
10.2.11 Scatter Plot: Diff. in WHS ~ Diff. in Logged GDP per capita
Consistent with the positively significant coefficients of Difference in GPD per capita (logged) shown in Models 3-4 of Table 2, the smooth regression line also shows that there is positive relationship between Difference in GPD per capita (logged) and difference in one country’s happiness score.

10.2.12 Scatter Plot: Diff. in WHS ~ Diff. in Social Support
Consistent with the positive relationship between Difference in Social support and Difference in Happiness Index shown in Models 3-4 of Table 2, the smooth regression line below also shows that the two variables are highly positively correlated. 
10.2.13 Scatter Plot: Diff. in WHS ~ Diff. in Healthy life expectancy at birth
Same with the positive relationship between Difference in Healthy Life Expectancy and Difference in Happiness Index shown in Model 3 of Table 2, the smooth regression line below also shows that the relationship between the two variables are positive. 
10.2.14 Scatter Plot: Diff. in WHS ~ Diff. in Freedom to make life choices
Consistent with the positive relationship between Diff. in Freedom to make life choices and Difference in Happiness Index shown in Models 3-4 of Table 2, the smooth regression line below also shows an obvious positive relationship between these two variables. 
10.2.15 Scatter Plot: Diff. in WHS ~ Diff. in Generosity
Same with the positive significant coefficient of Diff. in Generosity shown in Model 3 Table 2, the smooth regression line below also shows a slightly positive relationship between Diff. in Generosity and Difference in countries’ happiness index .

10.2.16 Scatter Plot: Diff. in WHS ~ Diff. in Perceptions of corruption
Consistent with the negative coefficient of Diff. in Perceptions of Corruption shown in Models 3-4 of Table 2, the smooth regression line below shows that the two variables are negatively correlated.

10.2.17 Scatter Plot: Diff. in WHS ~ Diff. in Democracy
There is no regression line in the scatter plot since the distribution of the scatter spots is so dispersed and could not generate a regression line, consistent with the 0 value of the coefficient for Difference in democracy in Model 4 of Table 2. 
10.2.18 Scatter Plot: Diff. in WHS ~ Diff. in Population (logged)
Same with the negative coefficient of Difference in Population (logged) shown in Model 4 of Table 2, the smooth regression line below shows that there is a negative relationship between Difference in Population (logged) and the difference in countries’ happiness index.

10.2.19 Scatter Plot: Diff. in WHS ~ Diff. in Population Density (logged)
Similar to the negative effect of Diff. in Population Density (logged) shown in Model 4 of Table 2, the smooth regression line shows a slightly negative relationship between Diff. in Population Density (logged) and countries’ happiness index. 
11 Conclusion
As mental health becomes one common social issue, policymakers consider people’s happiness more during decision-making. As a landmark report, World Happiness Report is distributed annually and provides a professional analysis of people’s happiness index and six closely related factors, including GDP per capita, social support, healthy life expectancy, freedom to make life choices, generosity, and perceptions of corruption across the country. However, the six factors are limited, and more factors correlate to people’s happiness index.
This research examines the relationship between six basic factors included in the World Happiness Report and the country’s happiness index. It further explores the effect of democracy level, five demographic factors – population size, population density, population net change, net migrants, and population density net change, and two COVID severity variables – COVID-19 deaths per 100,000 population in 2020 and Index of exposure to COVID-19 infections on people’s happiness score cross country.
The empirical tests based on two types of datasets – Dataset 1 based on World Happiness Report 2020 and 2021, and Dataset 2 based on World Happiness Report Panel Data during 2005-2020 find the six basic factors are highly correlated to countries’ happiness score as the reports analyze. Besides, the results support the positive correlation between democracy level and population size with people’s happiness index and find evidence of the negative relationship between population density, population net change, and population density net change with people’s happiness score. However, there is no evidence for the relationship between COVID-19 severity and people’s happiness score.
In the visualization part, most of the correlations between the variables and people’s happiness index is consistent with the statistical findings from the regression models, but there are some different findings. Firstly, the relationship between democracy and people’s happiness score is shown in a U shape, indicating that the most autocratic and most democratic countries tend to have higher happiness index compared to the countries whose level of democracy is between the two extreme directions, quite different from the positive linear regression results, providing no support to H1. Secondly, as for population size and population net change, different from the non-significance of the coefficients of Population in 2020 (logged) and Population Net Change (logged) shown in Models 2-3 of Table 1, the smooth regression lines based on Datasets 1 and 2 indicate that population size and population net change are both negatively correlated to the country’s happiness score, meaning the larger the population size, the rapid one country’s population size increases, the lower happiness index one country will have, providing support to H2a and H2b.
In conclusion, combined with statistical results with regression models and data visualization, there is no consistent support to H1. The smooth regression line shows the relationship between democracy level and one country’s happiness score following a U-shape rather than a linear regression line. However, the scatter plots with smooth regression lines provide more evidence for H2a and H2b. Thus, we could say population, and population density negatively correlates to one country’s happiness score. Also, larger population net change and population density net change will decrease one country’s happiness index. The research also indicates that data visualization could help us detect the unseen connections and relationships between the variables. Research results will be more objective and persuasive by combining empirical tests and data visualization.
12 References
Cheng, Cecilia, Mike W.-L. Cheung, Alex Montasem, and 44 members of the International Network of Well-Being Studies. 2016. Explaining Differences in Subjective Well-Being Across 33 Nations Using Multilevel Models: Universal Personality, Cultural Relativity, and National Income. Journal of Personality 84:1, 46-58.
Coppedge, Michael, John Gerring, Carl Henrik Knutsen, Staffan I. Lindberg, Jan Teorell, David Altman, Michael Bernhard, M. Steven Fish, Adam Glynn, Allen Hicken, Anna L¨uhrmann, Kyle L. Marquardt, Kelly McMann, Pamela Paxton, Daniel Pemstein, Brigitte Seim, Rachel Sigman, Svend-Erik Skaaning, Jeffrey Staton, Agnes Cornell, Lisa Gastaldi, Haakon Gjerløw, Valeriya Mechkov, Johannes von R¨omer, Aksel Sundtr¨om, Eitan Tzelgov, Luca Uberti, Yi-ting Wang, Tore Wig, and Daniel Ziblatt. 2019. “V-Dem Codebook v9” Varieties of Democracy (V-Dem) Project. Corderoa, José Manuel, Javier Salinas-Jiménezb, & M Mar Salinas-Jiménez. 2016. Exploring factors affecting the level of happiness across countries: A conditional robust nonparametric frontier analysis. European Journal of Operational Research 256 (2017), 663–672.
Easterlin, Richard A., Laura Angelescu McVey, Malgorzata Switek, Onnicha Sawangfa, & Jacqueline Smith Zwei. 2010. The happiness-income paradox revisited. Proceedings of the National Academy of Sciences of the United States of America, Vol. 107, No. 52, 22463-22468.
Frey, B., & A. Stutzer. 2002. Happiness & Economics. Princeton and Oxford: Princeton University Press.
Graham, C. 2008. Happiness and health: Lessons-and questions-for public policy. Health Affairs. 27(1), 72–87.
Helliwell, John F., Richard Layard, Jeffrey Sachs, & Jan-Emmanuel De Neve, eds. 2020. World Happiness Report 2020. New York: Sustainable Development Solutions Network.
Helliwell, John F., Richard Layard, Jeffrey Sachs, & Jan-Emmanuel De Neve, eds. 2021. World Happiness Report 2021. New York: Sustainable Development Solutions Network.
Kim-Prieto, C., Diener, E., Tamir, M., Scollon, C., & Diener, M. 2005. Integrating the diverse definitions of happiness: A time-sequential framework of subjective well-being. Journal of Happiness Studies. 6(3), 261–300.
Marshall, Monty G. & Ted Robert Gurr. 2020. Polity™ Project POLITY5 Political Regime Characteristics and Transitions, 1800-2018 Dataset Users’ Manual. Center for Systemic Peace.
Oishi, Shigehiro, Selin Kesebir & Ed Diener. 2011. Income Inequality and Happiness. Psychological Science. Vol. 22, No. 9, 1095-1100.
Scoffham, S., & Barnes, J. 2011. Happiness matters: Towards a pedagogy of happiness and well-being. Curriculum Journal. 22(4), 535–548.
Veenhoven, R. 2008. Healthy happiness: Effects of happiness on physical health and the consequences for preventive health care. Journal of Happiness Studies. 9(3), 449–469.
Weech-Maldonado, Robert, Michael J. Miller, & Justin C. Lord. 2017. The Relationships among Socio-Demographics, Perceived Health, and Happiness. Applied Research Quality Life. 12: 289–302.
12.1 Datasets:
Helliwell, John F., Richard Layard, Jeffrey Sachs, and Jan-Emmanuel De Neve. 2020. “World Happiness Report 2020 Data for Figure 2.1”. https://worldhappiness.report/ed/2020/. (November 29, 2021)
Helliwell, John F., Richard Layard, Jeffrey Sachs, and Jan-Emmanuel De Neve. 2021. “World Happiness Report 2021 Data for Figure 2.1”. https://worldhappiness.report/ed/2021/. (November 29, 2021)
Helliwell, John F., Richard Layard, Jeffrey Sachs, and Jan-Emmanuel De Neve. 2021. “World Happiness Report 2021 Data Panel”. https://worldhappiness.report/ed/2021/. (November 29, 2021)
Helliwell, John F., Richard Layard, Jeffrey Sachs, and Jan-Emmanuel De Neve. 2021. “World Happiness Report 2021 Mortality Data”. https://worldhappiness.report/ed/2021/. (November 29, 2021)
Marshall, Monty G. & Ted Robert Gurr. 2020. “Polity5: Regime Authority Characteristics and Transitions Datasets, v2018”. http://www.systemicpeace.org/inscrdata.html. (November 29, 2021)
Prabhu, T. N. Population by Country – 2020: https://www.kaggle.com/tanuprabhu/population-by-country-2020. World Bank. 2021. World Development Indicators – Population. https://databank.worldbank.org/source/world-development-indicators. (November 29, 2021)
World Bank. 2021. World Development Indicators – Population Density. https://databank.worldbank.org/source/world-development-indicators. (November 29, 2021)
Worldometer. 2020. “World Population”. https://www.worldometers.info/world-population/. (November 29, 2021)